


Understanding how users interact with your website is key to enhancing their experience and improving conversion rates. Heatmaps are simple, yet powerful tools that provide a visual representation of user behaviour on your website. This article will explore what heatmaps are, how they work, and how you can effectively implement and analyse them, so you know which areas on your page are overlooked, which areas have the highest engagement and if that pop up you added is actually helping or in fact frustrating your users.
What Is a Heatmap?
A heatmap is a data visualisation technique that represents values through colours. This method allows complex datasets to be presented in an intuitive way, making it easier to understand patterns and trends at a glance.
How Do Heatmaps Work?
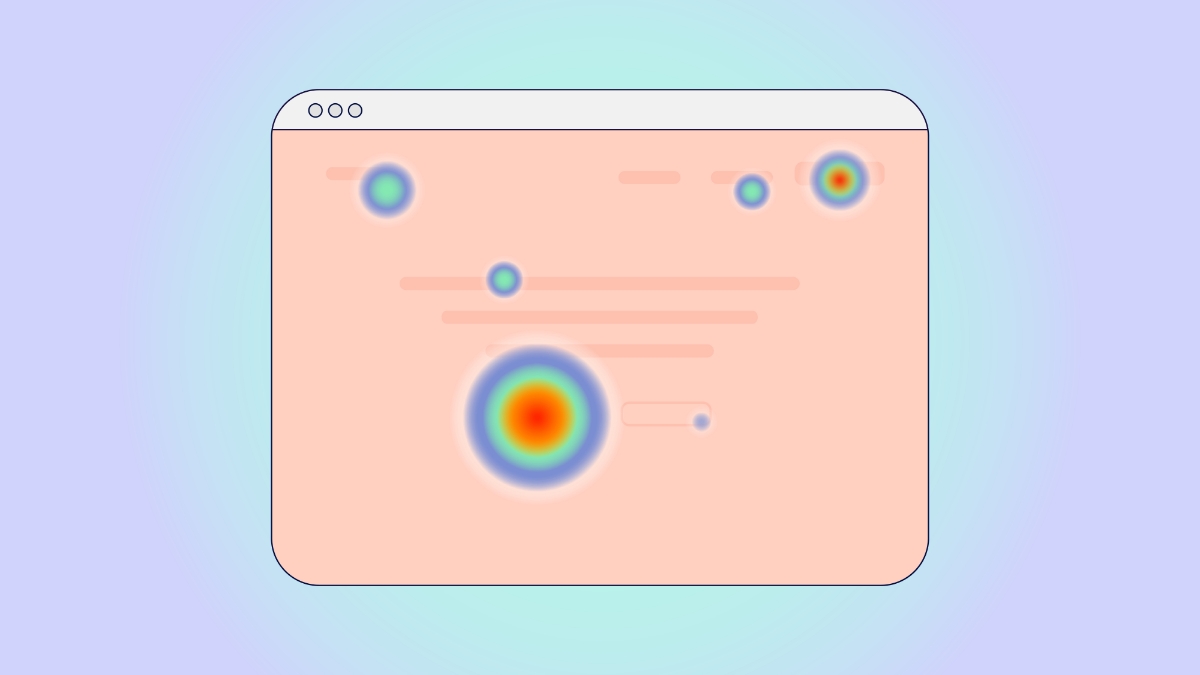
Heatmaps show you where users move, click, and scroll by visually representing user interactions on a webpage through colour-coded overlays, which highlight areas of varying activity levels. When a user interacts with your site—whether by clicking, scrolling, or moving their mouse—these actions are recorded and aggregated by heatmap software. The data is then translated into a heatmap visualisation, where warmer colours such as reds and oranges indicate high levels of interaction, and cooler colours like blues and purples show lower levels of activity (imagine one of those infrared cameras that capture heat signatures).
Different types of heatmaps show different things. For instance, a click map will display areas with frequent clicks in bright colours, while a scroll map will reveal how far down users typically scroll before losing interest. By analysing these visual patterns, you can gain insights into user behaviour, identify engagement hotspots, and understand how users navigate your site, allowing for targeted improvements and optimisations.
Types of Website Heatmaps
Heatmaps come in various types, each serving a specific purpose. Understanding these can help you tailor your analysis to your specific needs:
- Click Maps: These heatmaps show where users click on a page. Areas with high click density are represented in warmer colours, while less clicked areas are cooler. This helps identify which elements are attracting attention and which are being ignored.
- Scroll Maps: Scroll maps illustrate how far down the page your users typically scroll. This can reveal whether important content is getting cut off and can help optimise the placement of key elements.
- Move Maps: These heatmaps track where users move their mouse on a page. Since mouse movements can correlate with attention, move maps provide insights into which areas users focus on even if they don’t click.
- Attention Maps: Attention maps combine data from clicks, movements, and scrolls to give an overall view of where users are paying the most attention on a page.
- Error Click Maps: These heatmaps show where users click on non-clickable elements, which can indicate areas of confusion or frustration.
- Dead Click Maps: These highlight areas where users clicked but found no action, revealing elements that might be misleading or broken.
Implementing & Analysing Heatmaps
- Set Up Tracking: First you need to implement the heatmap tracking code on your website. This often involves adding a small snippet of JavaScript code to your site.
- Define Your Goals: Next you need to determine what you want to learn from the heatmaps. Are you interested in understanding user clicks, how far users scroll, or where they move their mouse? Your goals will guide the type of heatmaps you focus on.
- Collect Data: Once the heatmap is implemented on your website, the heatmap tool will collect data over a specified period. The amount of data needed depends on your website’s traffic.
- Analyse Results: Review the heatmap visualisations to identify any patterns. Look for areas with high or low engagement and consider how these patterns align with your site’s goals. For instance, if a critical call-to-action (CTA) button is not receiving clicks, it might need to be repositioned or redesigned.
- Test and Iterate: Implement changes based on the hypotheses from your analysis and monitor the results using new heatmaps. This iterative process helps refine your page design and structure, and continuously improve user experience.
Benefits of Using Heatmaps
- Identify Engagement Patterns: Heatmaps reveal where users engage most on your site, allowing you to optimise high-engagement areas and address issues in low-engagement zones.
- Enhance User Experience: By understanding how users interact with your site, you can make informed changes to improve usability and satisfaction.
- Reduce Guesswork: Heatmaps provide empirical data that helps you make decisions based on actual user behaviour rather than assumptions or guesswork.
- Optimise Conversions: Insights from heatmaps can guide the redesign of key elements to improve conversion rates, reduce bounce rates, and ultimately drive more sales or sign-ups.
- Gather User Feedback: Some heatmap tools offer features for collecting user feedback directly on the page, providing additional context to the data and helping you understand user preferences better.
Conclusion
Businesses are leveraging heatmaps to gain a precise understanding of how users interact with their sites, allowing them to enhance the overall user experience and boost their conversion rates. By visualising user interactions in a clear and actionable way, you can see where users move, click or scroll and then use this data to remove friction points and create a more engaging and effective user experience.
However, implementing a heatmap isn’t the be-all and end-all answer to improving user experience on your website, analysing heatmaps may in-fact raise additional questions about user behaviour. To address these, it’s beneficial to combine heatmap analysis with other user experience and feedback tools to help you understand more about why your users behave the way they do when interacting with your site.
Unsure where to start?
Heatmaps are fundamental to creating websites that are not only functional and usable but also engaging and satisfying for users. It is one part of a holistic approach that considers the entire journey of the user. Connect with Greenhat and dive deeper into web strategies that align with your goals.